Timeline Analytics

Roman Savchuk
Last Update 4 jaar geleden
LinkPeak allows you to get an understanding of how followers are interacting with the content you are sharing, get insights on their content consumption habits, and make informed decisions about what to share next.
How to view Timeline Analytics:
1. Login to your LinkPeak admin here
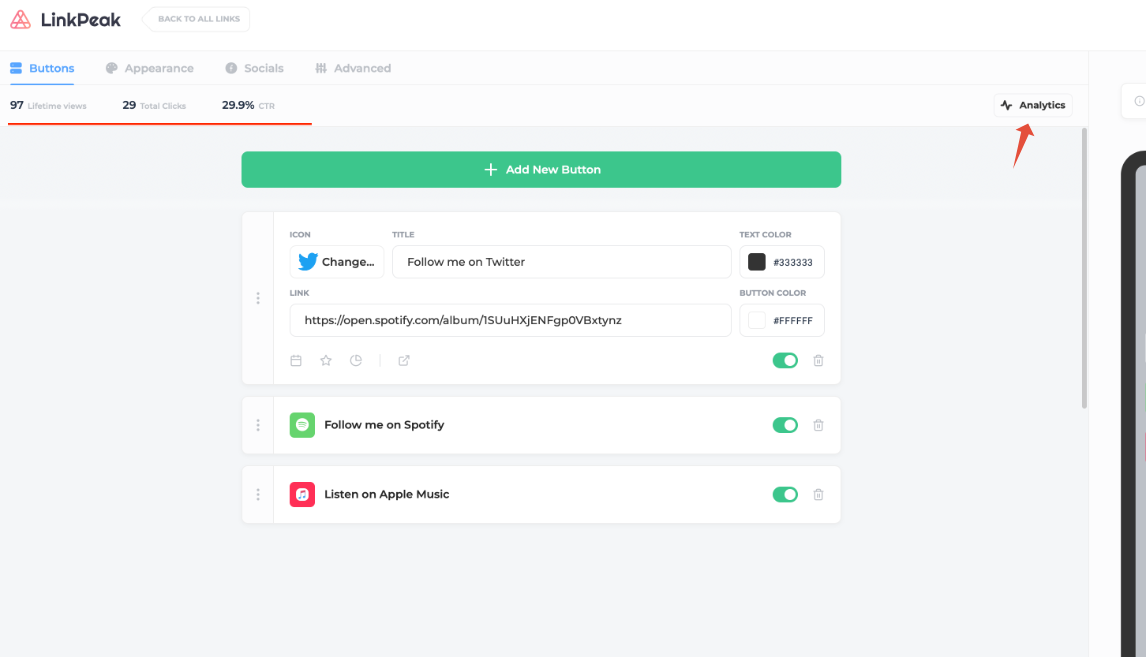
2. On your Dashboard, click on the link for which you want to see the analytics
3. Click on the 'Analytics' button to get more detailed stats of the link.
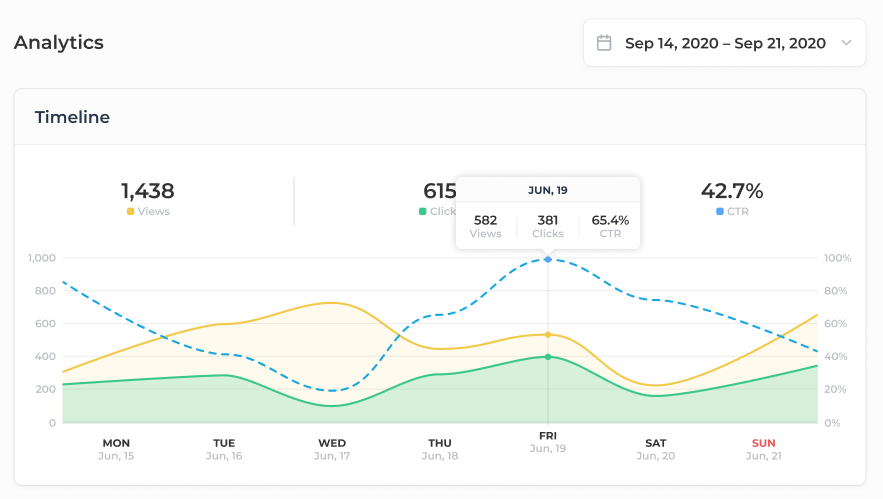
4. The Timeline chart shows you in a visual way how your visitors have interacted with your links over time. You can see how many Views and Clicks your LinkPeak got, and also the Click-through rate.
You can select the time frame you want to check up.
What is Lifetime views?
Lifetime Views represent all traffic that has arrived to your LinkPeak.
What is Total clicks?
Total clicks represent the total number of clicks visitors have performed on your links and buttons.
What is CTR?
The click-through rate (CTR) is the percentage of people who have viewed your link or button and clicked on it.
CTR measures how successful your content is in capturing visitors' attention.
The higher the click-through rate, the more successful the content has been in generating interest.
Click-through rate (CTR) is calculated by dividing the number of clicks by the number of views your LinkPeak link or button has received, and multiplied by 100 to get a percentage.
For example, if you have 10 clicks and 20 views, your CTR is 50% (20/1000x100).
If you have any questions, please contact our customer support at [email protected]